
Core Concepts
Service Catalog
What is the Service Catalog?
Available on Team and Enterprise
The AI Service Catalog is available on Team and Enterprise plans. See pricing for details.
CodeCargo uses machine learning, GenAI, and declarative code to automatically generate and maintain your Service Catalog. Teams no longer have to spend countless hours maintaining the Service Catalog - our platform does this for you giving you more time to actually build, test, and deploy your software.
Think of it as an automatically generated map of your software architecture that shows:
- What services exist in your codebase
- How components depend on each other
- Who owns and maintains each component
- Which CI/CD pipelines build, test, and deploy your code
- How your code is organized across repositories
Why Use the Service Catalog?
For New Team Members:
- Quickly understand your organization's architecture
- See how different services and components connect
- Identify who to talk to about specific components
For Architects & Technical Leads:
- Get a bird's-eye view of system architecture
- Identify architectural patterns and anti-patterns
- Spot tightly coupled components that might need refactoring
- Understand service boundaries and deployment patterns
For DevOps & Platform Engineers:
- See which components have CI/CD pipelines
- Understand deployment relationships
- Track infrastructure-as-code components
- Identify missing automation
For Engineering Managers:
- Understand team ownership boundaries
- See contribution patterns across repositories
- Identify knowledge silos or single points of failure
Accessing the Service Catalog
The Service Catalog is available at three levels, each providing different levels of detail:
Organization Level
View the complete architecture across your entire organization, including:
- All repositories
- All services and components
- All relationships and dependencies
- All owners and contributors
Best for: High-level architecture reviews, organization-wide planning, and cross-team coordination.
Project Level
See only the components and services within a specific project:
- Repositories belonging to the project
- Components within those repositories
- Relationships between project components
Best for: Project planning, team coordination, and understanding project-specific architecture.
Repository Level
Zoom in on a single repository:
- All components within the repository
- Internal dependencies
- External dependencies to other repositories
- CI/CD pipelines for this repository
Best for: Deep-diving into specific repositories, understanding component structure, and detailed dependency analysis.
How the Service Graph is Created
The Service Catalog uses an intelligent multi-stage analysis pipeline that runs automatically. Here's what happens behind the scenes:
Stage 1: Component Discovery
The system scans your codebase looking for components by identifying common patterns:
Code Components:
- Projects with package managers (
package.json,pom.xml,requirements.txt, etc.) - Applications with specific frameworks
- Libraries and shared code
Infrastructure Components (IaC):
- Terraform configurations
- CloudFormation templates
- Kubernetes manifests
- Docker configurations
CI/CD Components:
- GitHub Actions workflows
- Jenkins pipelines
- Other automation scripts
For each component, the system extracts:
- Component type and language
- Location in the codebase
- Configuration files
- Dependencies declared in manifests
Stage 2: Ownership Analysis
The system analyzes your Git history to determine component ownership:
- Reviews commit history to identify primary contributors
- Checks for CODEOWNERS files
- Analyzes contribution patterns and frequency
- Identifies the most active maintainers
This helps you know who to contact for questions or changes.
Stage 3: Dependency Analysis
We use deterministic and Machine Learning algorithms along with our AI Agent to:
- Analyze import statements across different programming languages
- Understand semantic relationships between components
- Detect implicit dependencies that aren't declared in manifests
- Map communication patterns between services
CodeCargo understands:
ComponentA imports from ComponentB
→ Creates dependency relationship
This goes beyond simple text matching—the AI understands different programming paradigms, import styles, and language-specific patterns.
Stage 4: CI/CD Pattern Detection
The system identifies which components are actively built and deployed:
- Scans workflow files (GitHub Actions, Jenkins, etc.)
- Identifies build steps for each component
- Detects test automation
- Discovers deployment patterns (which components get deployed where)
- Tracks publish operations (npm, Docker, Maven, etc.)
- Maps deployment environments (staging, production, etc.)
Stage 5: Service Boundary Detection
Using the CI/CD analysis, the system automatically identifies service boundaries:
A component becomes a "service" when:
- It has a CI/CD pipeline that deploys it somewhere
- It represents a deployable unit (API, web app, worker, etc.)
Components that are NOT services:
- Libraries (published but not deployed)
- Shared utilities
- Test fixtures
The system assigns each service a unique identifier and groups related components together.
Stage 6: Relationship Mapping
Finally, all the data is assembled into a graph database where:
- Nodes represent repositories, components, and owners
- Edges represent relationships (dependencies, ownership, CI/CD connections)
- Metadata includes detailed information about each relationship
This graph structure allows powerful queries like:
- "Show me all services that depend on ComponentX"
- "Which components does TeamY own?"
- "What gets deployed to production?"
Repository Filtering
The Service Catalog automatically filters to show only active repositories. Inactive or archived repositories are excluded from all Service Catalog views, ensuring you see only the components and services that are currently maintained and operational.
This filtering applies across all Service Catalog levels:
- Organization-wide views show only active repositories
- Project-level catalogs include only active repositories within the project
- Repository-level views are only available for active repositories
Repository Status
Repository status is determined by GitHub's repository settings. Archived or disabled repositories will not appear in the Service Catalog, and their components won't be included in dependency analysis.
Service Catalog Detection Retry
CodeCargo automatically scans repositories to detect services and components for the Service Catalog. If a scan gets stuck or fails, you can retry the detection process:
- Stuck scans show an alert with a Retry scan button instead of an endless spinner
- Failed scans display the failure reason in tooltips and scan button titles
- Manual retry is available from the repository list actions menu (⋯ → Retry detection)
- Single repository retry can be triggered from the Service Catalog page when a scan is stuck or failed
The retry process creates a fresh scan with new credentials, ensuring that stuck scans don't interfere with new detection attempts. Scans are considered stale after 30 minutes of inactivity.
Scan Recovery
If a repository shows "Scanning" indefinitely, the retry functionality will automatically detect the stale scan and allow you to restart the detection process.
Understanding the Dashboard
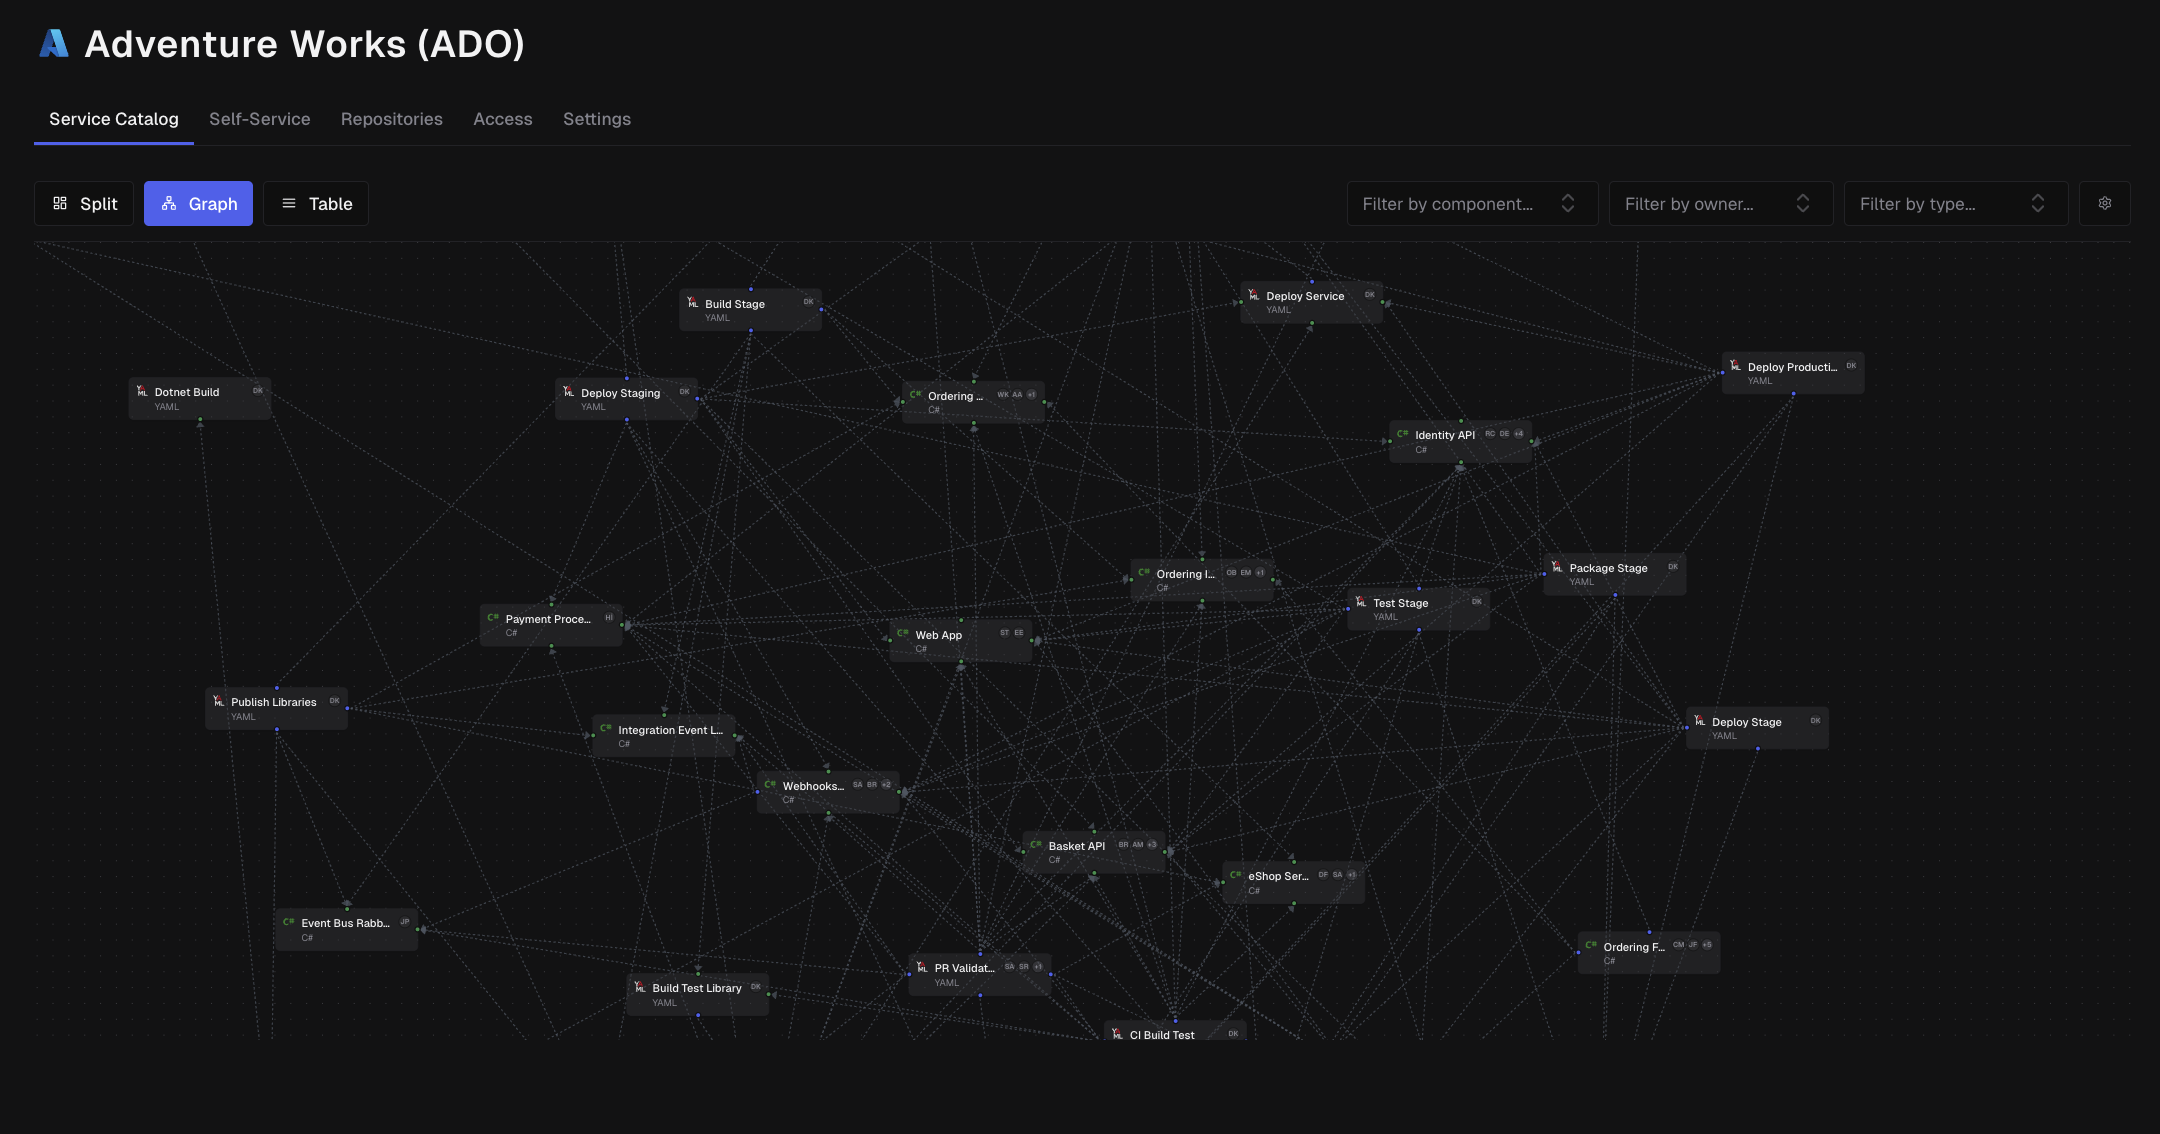
The Service Graph
The graph visualization shows your architecture as an interactive diagram:
Node Types
Repository Nodes (Large containers)
- Represent Git repositories
- Contain component nodes
- Show repository name
- Display edge count badges
Component Nodes (Colored boxes)
- Represent individual components
- Show component name
- Display programming language icon
- Show owner avatars (up to 2 + count)
Owner Nodes (Person icons)
- Represent component owners/maintainers
- Show avatar and name
Connections (Edges)
Lines between nodes show relationships:
- Solid lines: Direct dependencies
- Arrows: Direction of dependency (A depends on B)
- Connected repositories: Indicate cross-repository dependencies
Filtering and Exploration
Component Type Filters
Control which components appear:
- Code → Services: Show only deployable services
- Code → Non-Services: Show libraries and utilities
- IaC: Show infrastructure-as-code components
- CI/CD: Show active CI/CD pipelines
- CI/CD - Other: Show other automation components
Pro tip: Start with "Code → Services" to see your main services, then expand to see supporting components.
Component Filter (Multi-Select)
Select specific components by name:
- Search for components in the dropdown
- Select multiple components
- Graph updates to show only selected components and their immediate relationships
Use case: "Show me ComponentX and everything it depends on"
Owner Filter (Multi-Select)
Filter by component ownership:
- Select one or more owners
- See only components they maintain
- Understand ownership distribution
Use case: "Show me everything TeamY owns"
View Settings
Show Owner Icons: Toggle visibility of owner avatars on component nodes
- Turn on to see ownership at a glance
- Turn off for a cleaner view when ownership isn't the focus
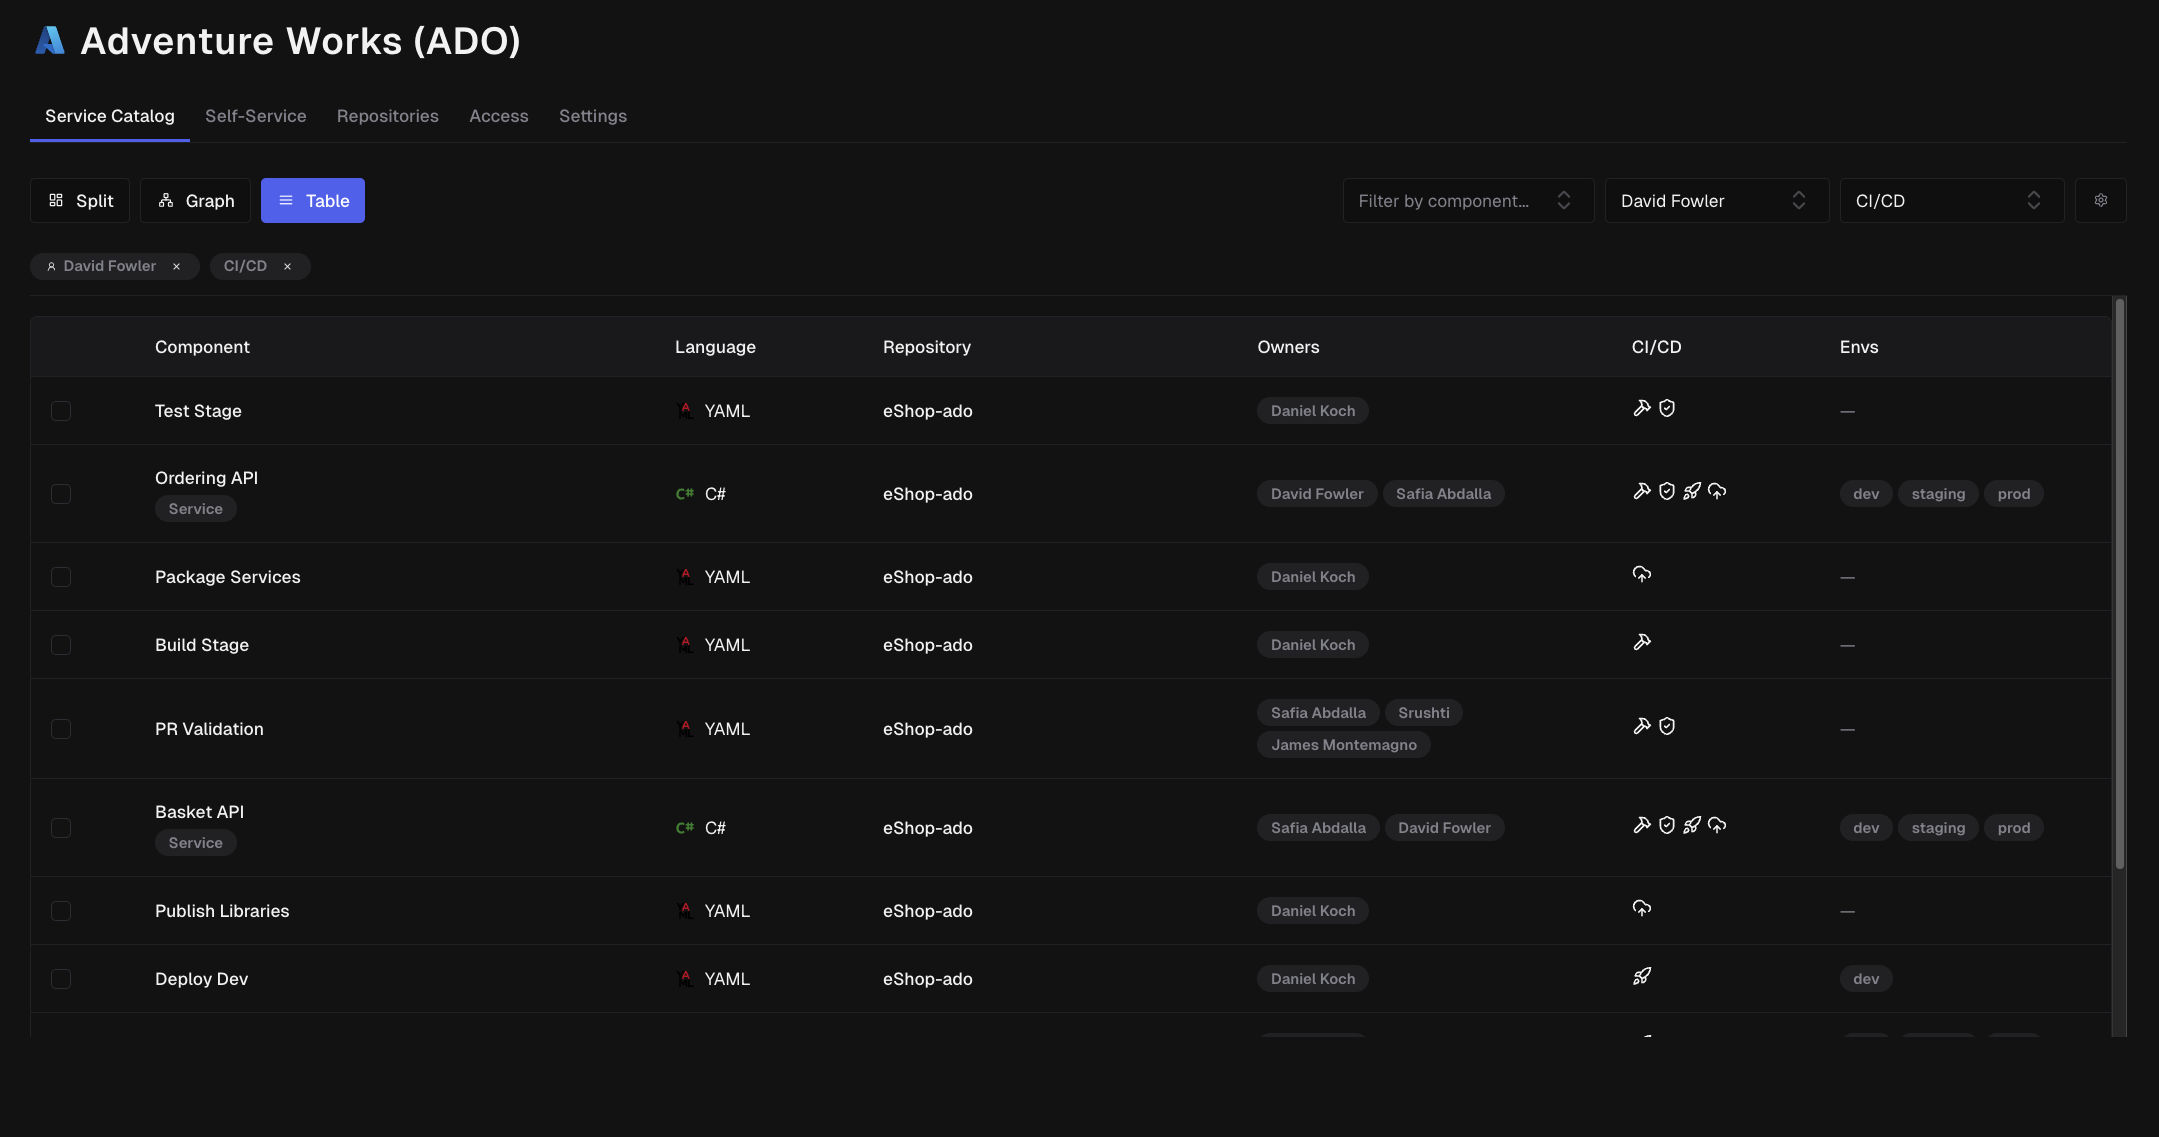
The Component Table
The table view provides a detailed, searchable list of all components:
Columns
| Column | Description |
|---|---|
| Title | Component name and identifier |
| Type | Code, IaC, or CI/CD |
| Language | Programming language or framework |
| Repository | Which repository contains this component |
| Owners | Avatars of primary maintainers |
| CI/CD | Build, test, deploy, and publish indicators |
| Environments | Where this component deploys (staging, prod, etc.) |
CI/CD Indicators
Icons show which CI/CD operations are configured:
- 🔨 Build: Component has automated builds
- ✓ Test: Component has automated tests
- 🚀 Deploy: Component has automated deployment (indicates a service)
- 📦 Publish: Component is published to a registry (npm, Docker Hub, etc.)
Common Use Cases
1. Understanding a New Codebase
Scenario: You just joined the team and need to understand the architecture.
Steps:
- Go to the Organization-level Service Catalog
- Enable "Code → Services" filter only
- Review the graph to see main services
- Identify central services (highly connected nodes)
- Click on services relevant to your team
- Follow dependencies to understand service relationships
2. Planning a Refactoring
Scenario: You need to update ComponentX and want to know what will be affected.
Steps:
- Go to the Repository or Project-level catalog
- Use the Component filter to select ComponentX
- Review all components that depend on ComponentX (incoming connections)
- Check which services ultimately depend on your changes
- Identify owners of dependent components for coordination
- Plan your rollout strategy based on dependency chain
3. Identifying Missing Automation
Scenario: You want to ensure all services have proper CI/CD pipelines.
Steps:
- Apply "Code → Services" filter
- Switch to Table view
- Sort by CI/CD columns
- Look for services missing Deploy indicators
- Prioritize adding automation to high-impact services
4. Understanding Ownership Gaps
Scenario: You need to ensure adequate coverage for on-call rotations.
Steps:
- Enable the Owner filter
- Review components without owners (or with single owners)
- Identify critical services with insufficient ownership
- Review the table view for team planning
5. Architectural Review
Scenario: You're conducting a quarterly architecture review.
Steps:
- Start at Organization level using the graph in split view
- Present the high-level architecture
- Identify tightly coupled clusters (many interconnected nodes)
- Drill down to Project level for specific areas of concern
- Review service boundaries and suggest improvements
6. Cross-Team Coordination
Scenario: Multiple teams are working on related services and need to coordinate.
Steps:
- Use Owner filters to select both teams
- Review shared dependencies
- Identify services where teams interact
- Plan integration points and communication strategies
Deep Linking and URL Sharing
The Service Catalog supports deep linking, allowing you to share specific filtered views with your team or bookmark complex filter combinations for later use.
Shareable URLs
All filter states are preserved in the URL, including:
- Component type filters (
types=code-services,iac) - Specific components (
components=component-id-1,component-id-2) - Owner filters (
owners=team-id-1,team-id-2) - Search queries (
search=api) - View mode (
view=splitorview=table)
Simply copy the URL from your browser to share a filtered view with colleagues.
URL Parameter Handling
The Service Catalog intelligently handles URL parameters:
- Invalid component or owner IDs fall back to the default view (code services)
- Invalid type filters show an empty state with helpful suggestions
- Missing type parameter defaults to showing code services
- Invalid view modes default to split view
Persistent Filters
When you reload a page with deep link parameters, your filter selections are preserved exactly as they were when the URL was created.